To access advanced analytics
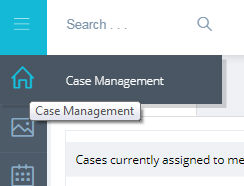
open case management from side menu
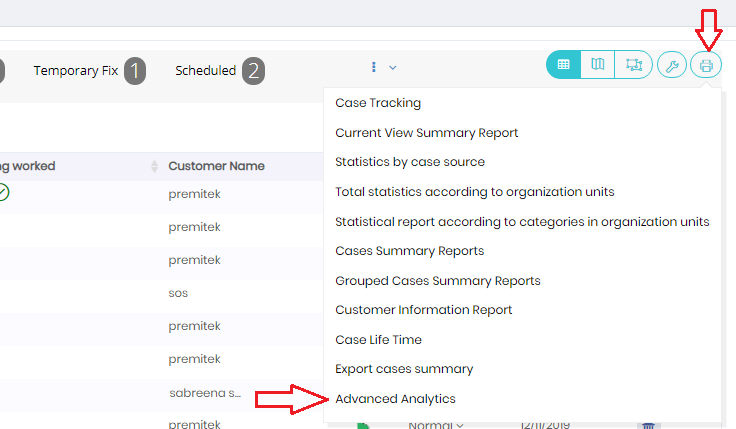
Then click on reports icon above case management table and select Advanced analytics
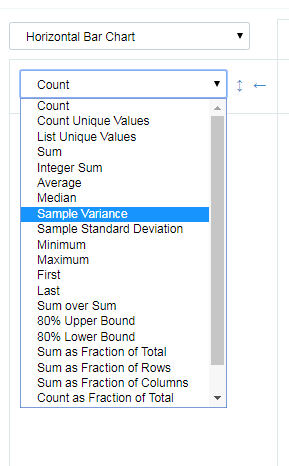
Use filters and columns in the case management view to prepare the input data set to be used in this analytics tool. A new tab will open. use your mouse to drag and drop one or more fields from the available attributes in the left to the rows and columns area of the analytics tool. The default aggregation function is count but you can change that to other aggregation function like sum, average, or any other available function.
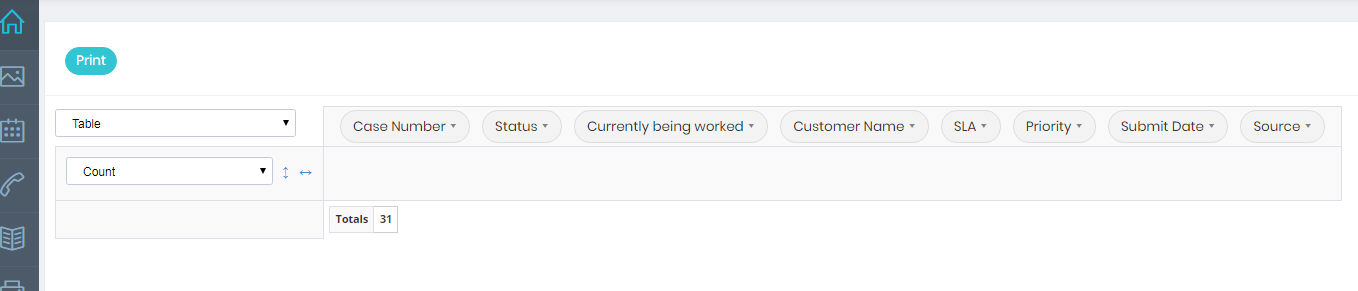
Select rows and columns by dragging and dropping fields to the rows and columns areas
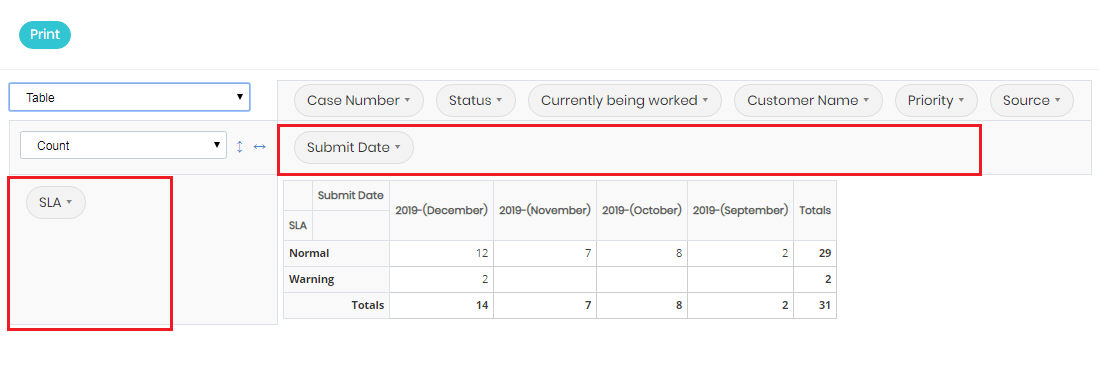
In the previous chart, you can display the total number of cases according to their SLA status by month
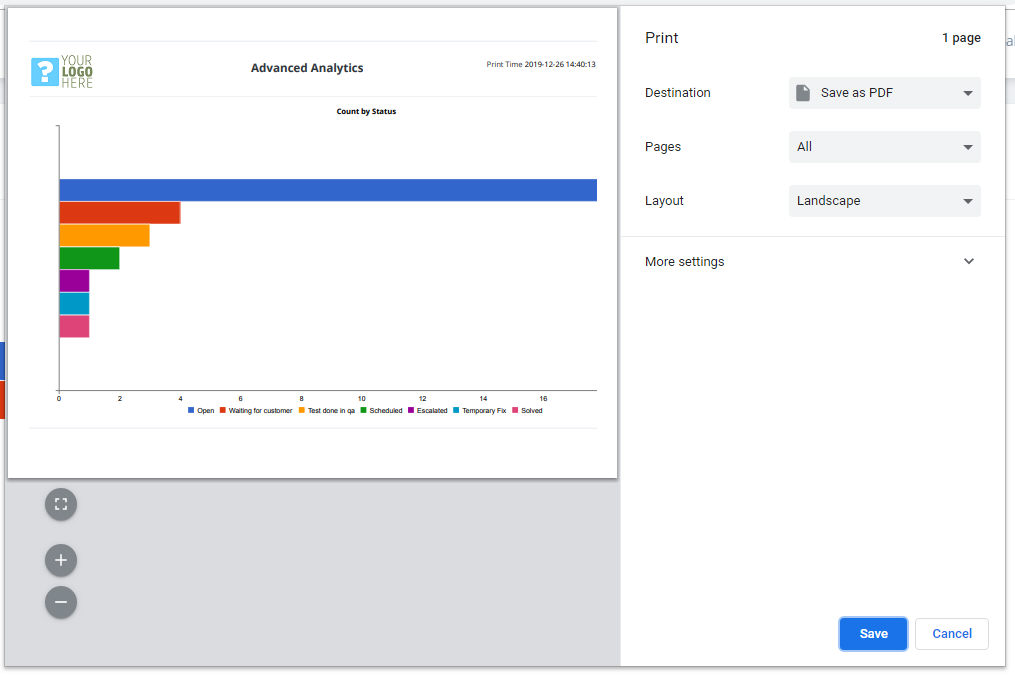
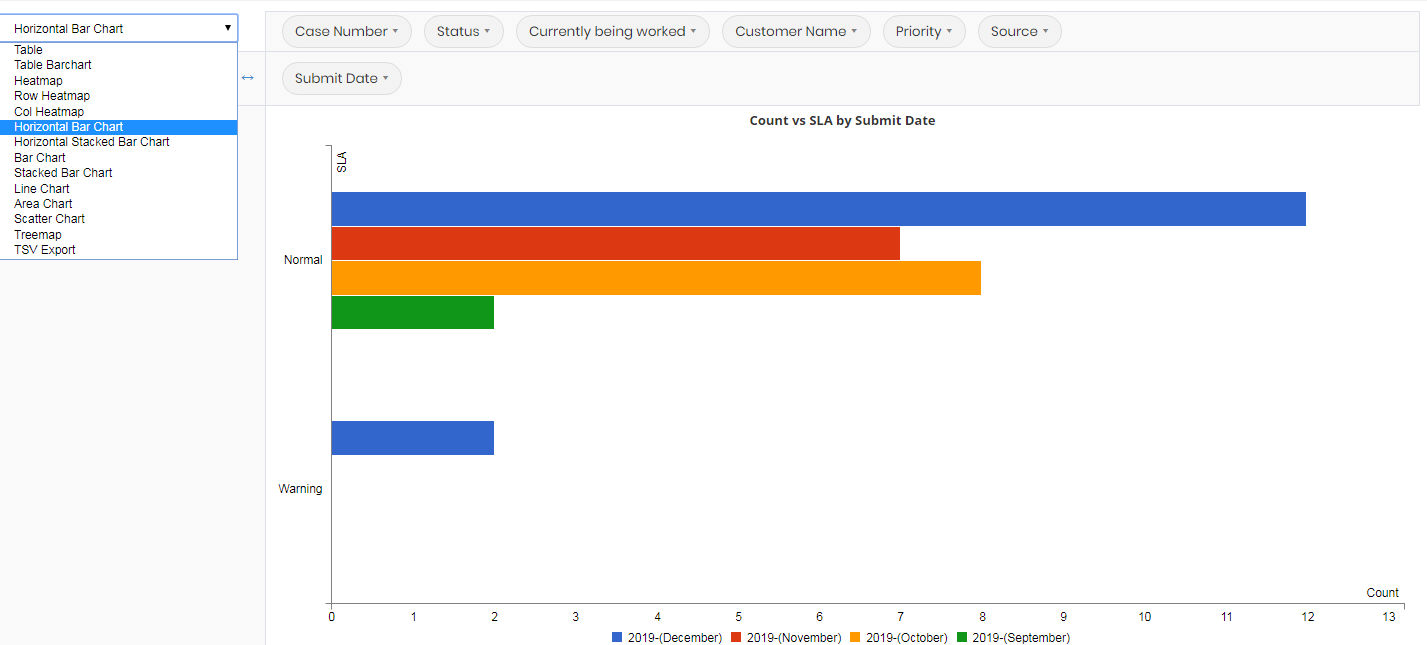
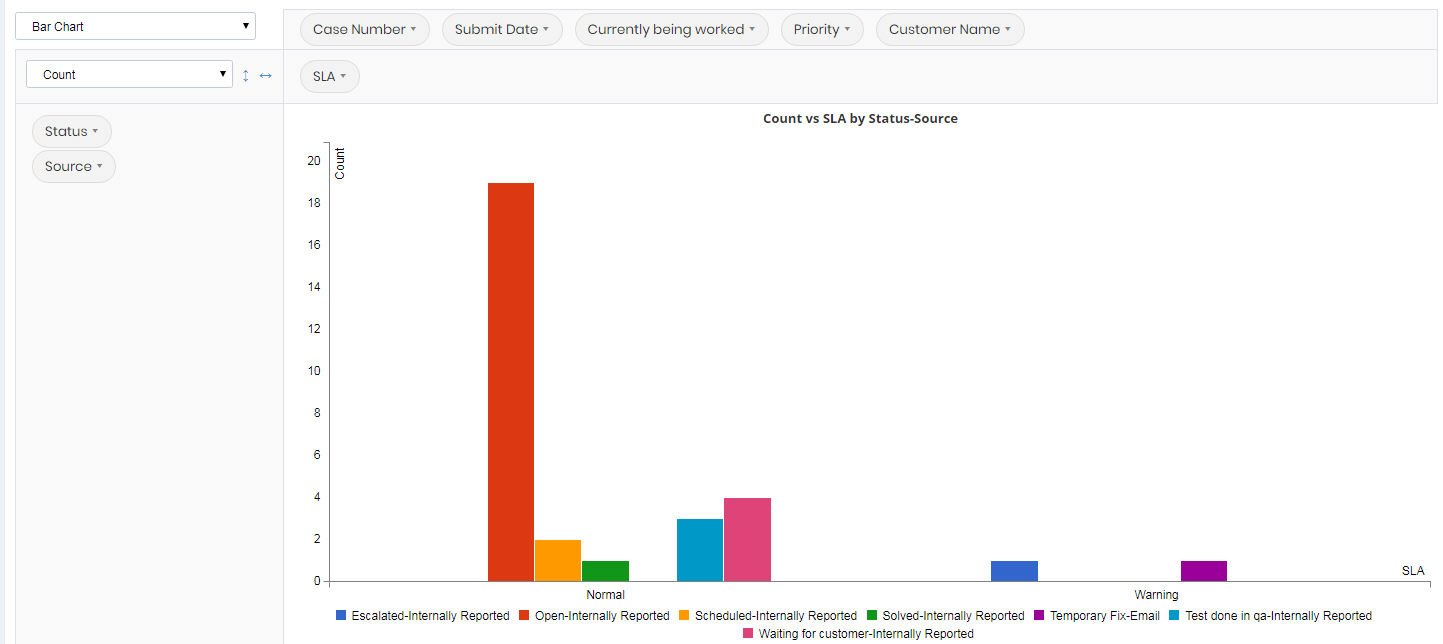
You can change the table and display the data in any chart type you want , such as horizontal bar chart.
You can select aggregation function from Drop down list
You can print the results by clicking on the Print button