Generating standard reports
NABD provides standard
reports that give you a close look at cases and how these cases are being
managed by your agents.
These standard reports are available in NABD:
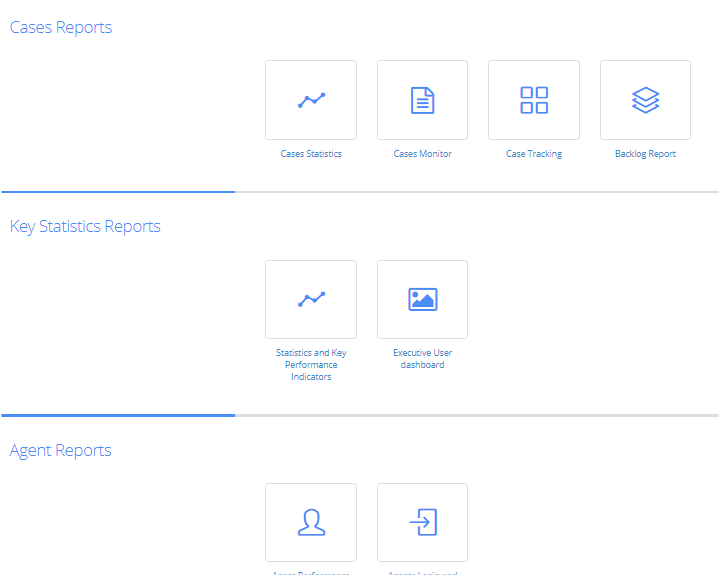
Complaint Statistics
Complaint Monitor
Executive User
dashboard
Agent Performance
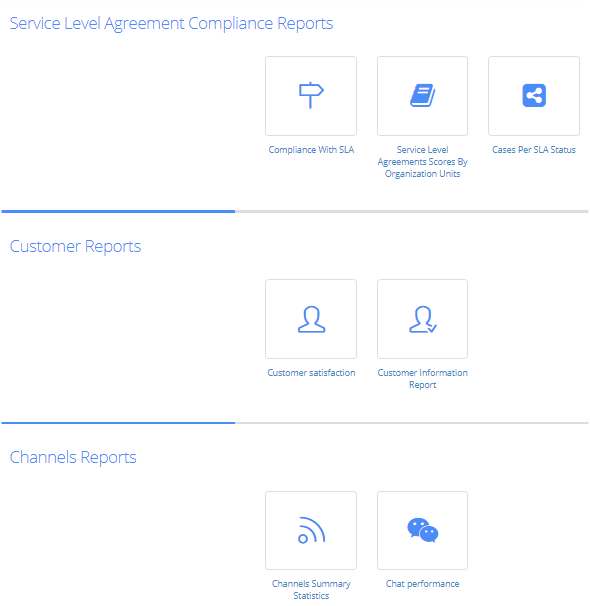
Compliance with SLA
Service Level Agreements Scores By Organization
Units
Case Tracking
Cases per SLA Status
Statistics and Key Performance Indicators
Customer satisfaction
Customer Information Report
Agents Login and Logout
Chat performance
Channels Summary Statistics
Backlog Cases Report
You can generate a report for this month, last month, or a specific
date range. Once you click View, you will be prompted to save or open
the report in a PDF file. Each report will be customized with your name
and logo at the top of each page.
To generate a standard report:
From your left main menu, select Reports.

On the Reports page, do the following:
Select the report you want to print.

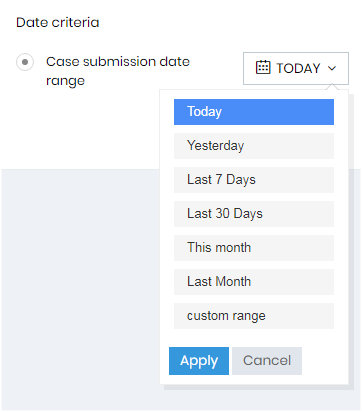
Select the date criteria you
want to use for this report.
If you select Date range, select the case
submission from date and then the to
date from the drop down calendars.
Click View.
the report will be displayed in the crystal report viewer.
General Crystal report settings:
- The report will be shown in the Crystal
Viewer.
To print the report, select print
from the crystal report toolbar.
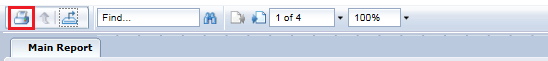
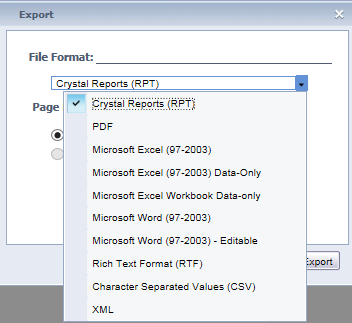
To export the report, select export
from the crystal report toolbar.
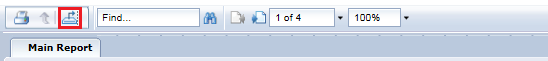
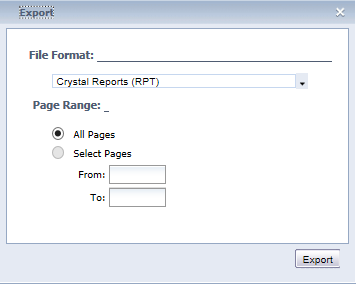
you can select the file format from the drop down list
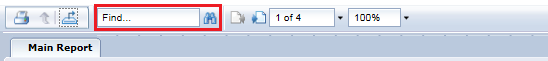
To search for a word in the report, type the word
in the find field then select Search
from the crystal report toolbar.
To navigate between the report pages select next and previous
from the crystal report toolbar.
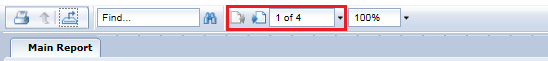
you can also go to the desired page by selecting the page number from
the drop down listTo zoom in or zoom out the report, select the
desired resolution from the
crystal report toolbar.

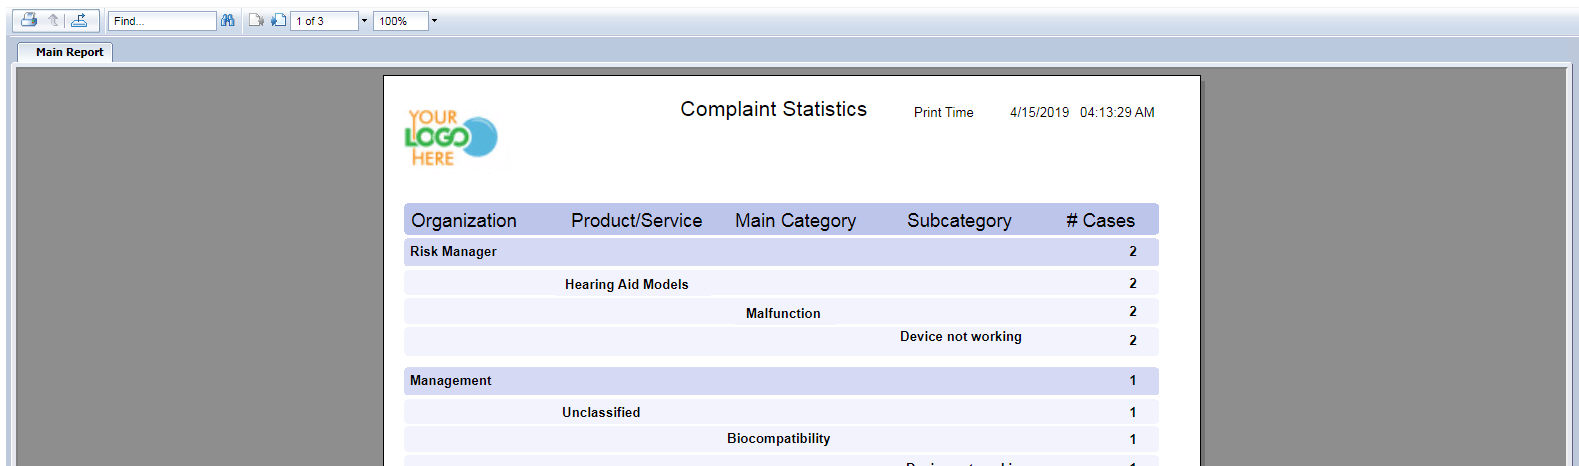
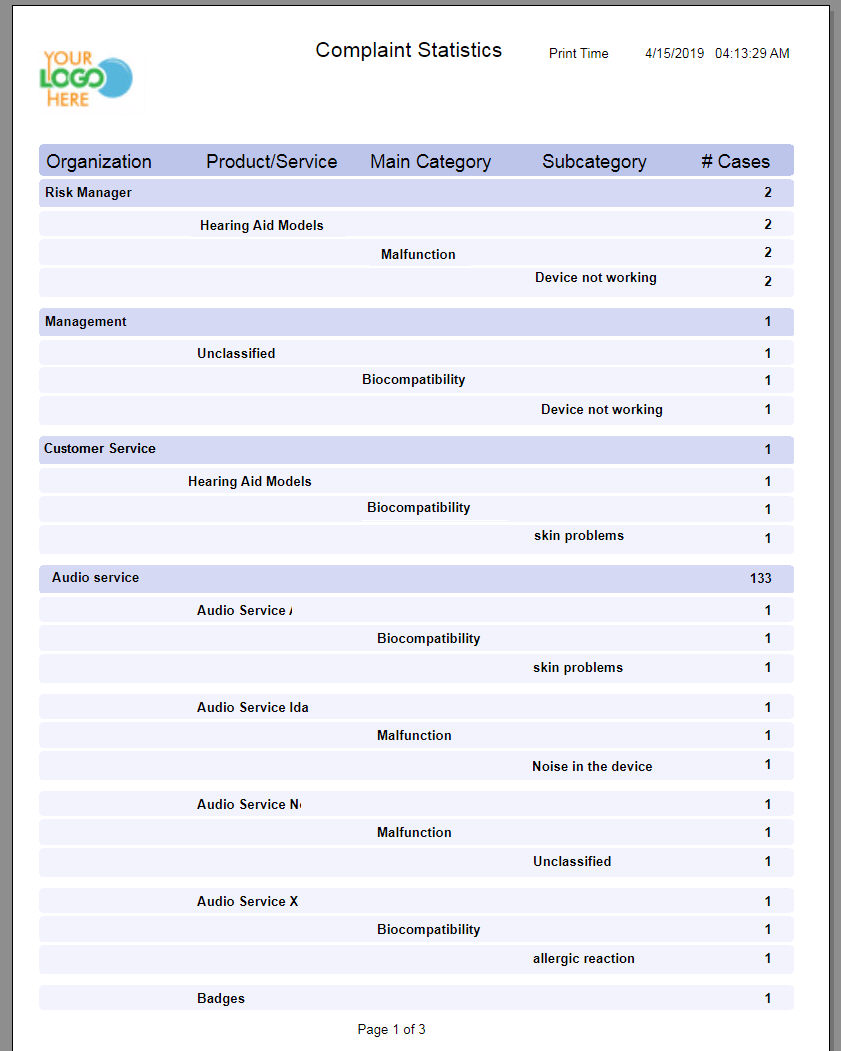
Complaint Statistics report
The Complaint Statistics report provides you with the
total number of cases by product/service, main category, and subcategory
for each administrative unit.
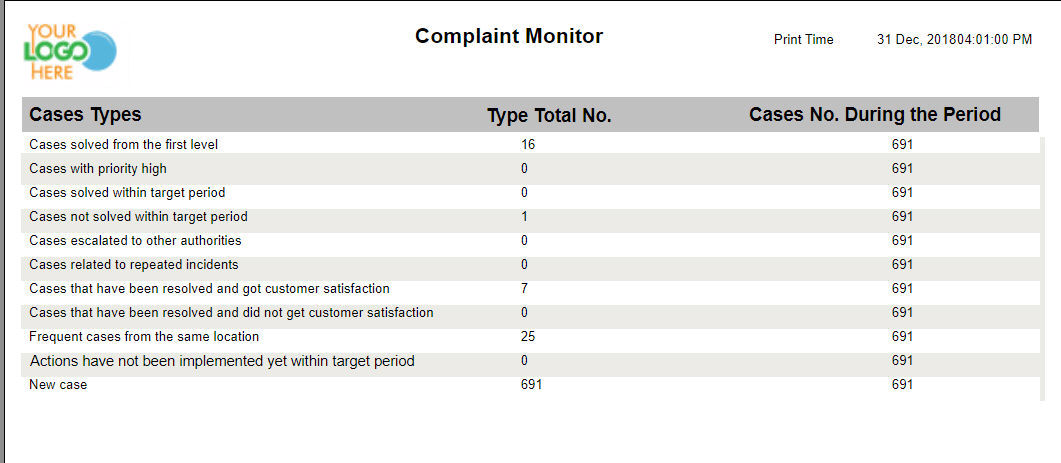
Complaint Monitor report
The Complaint Monitor report provides you with the following
case information:
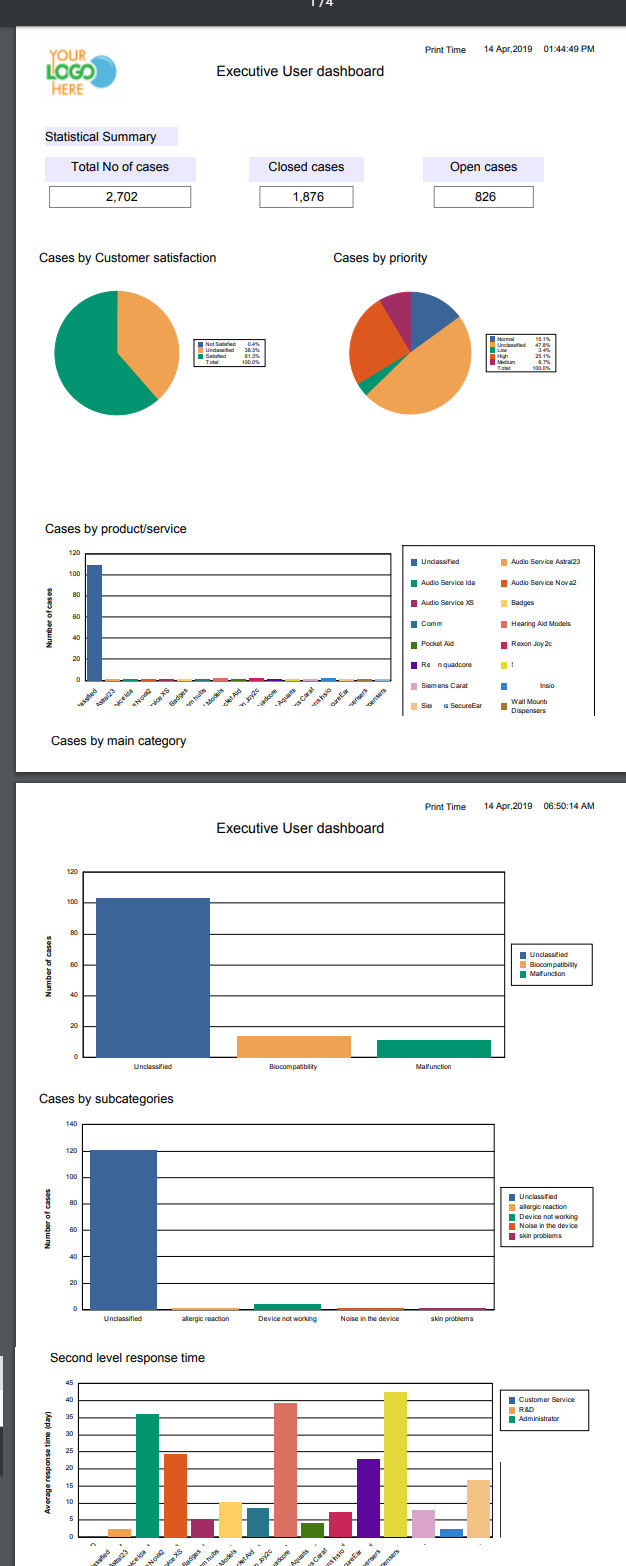
Executive User dashboard report
The Executive User dashboard report provides you with
a report format of the charts you are using on your User Dashboard.
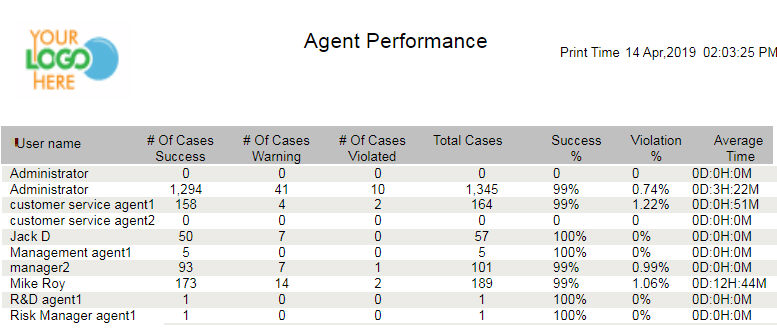
Agent Performance report
The Agent Performance report provides you with detailed
information on individual agent performance. This includes the number
of cases closed successfully and also the number of cases this agent has
in warning and violation status. The report also provides a statistical
analysis of the individual agent's successful and violation cases and
the average time this agent spent on a case.
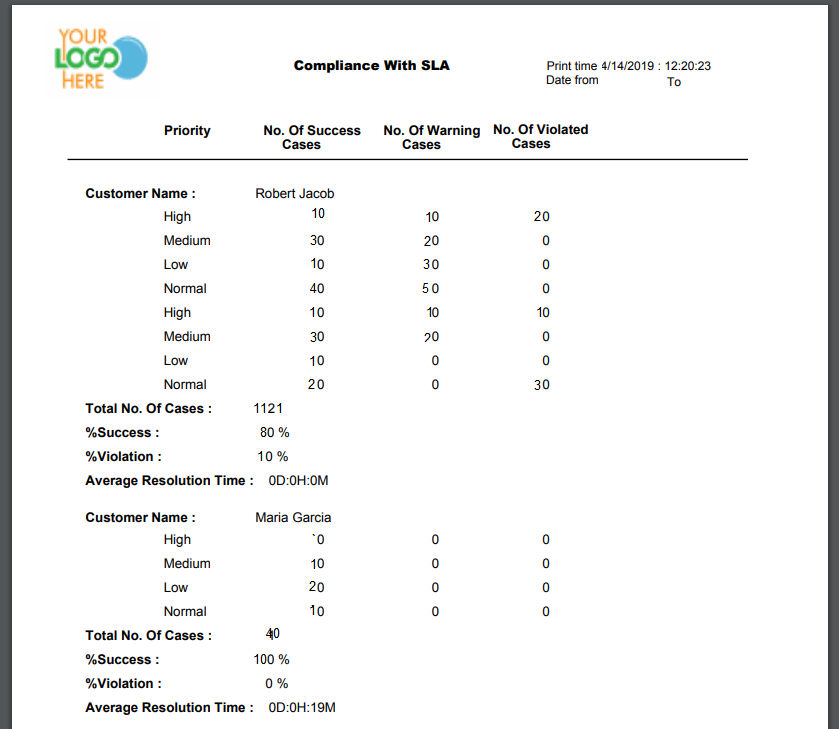
Compliance with SLA report
The Compliance with Service Level Agreements report provides
you with detailed service level agreement information for each customer.
Information includes a breakdown of cases –
successful, warning, and violations. It also provides percentages of successful
and SLA violation cases and also the average resolution time of a case
for the customer.
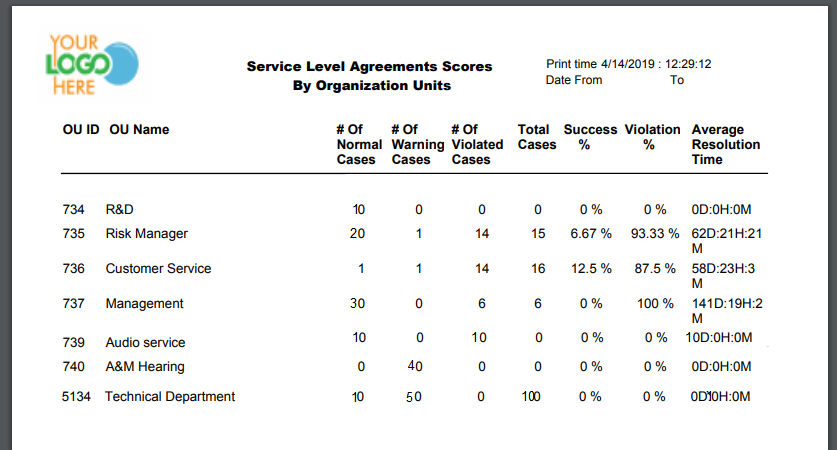
Service Level Agreements Scores By Organization Units
report
The SLA Scores by OU report provides you with detailed
information on your service level agreement by organizational
unit.
You can see the total number of cases within the normal
service level agreement time frame and also the number of cases in warning
and the total number of cases that have violated the service level agreement.
In addition to providing the average case resolution time,
the report also includes the percent of cases in the organizational unit
that met the SLA and also the number of cases that violated the SLA.
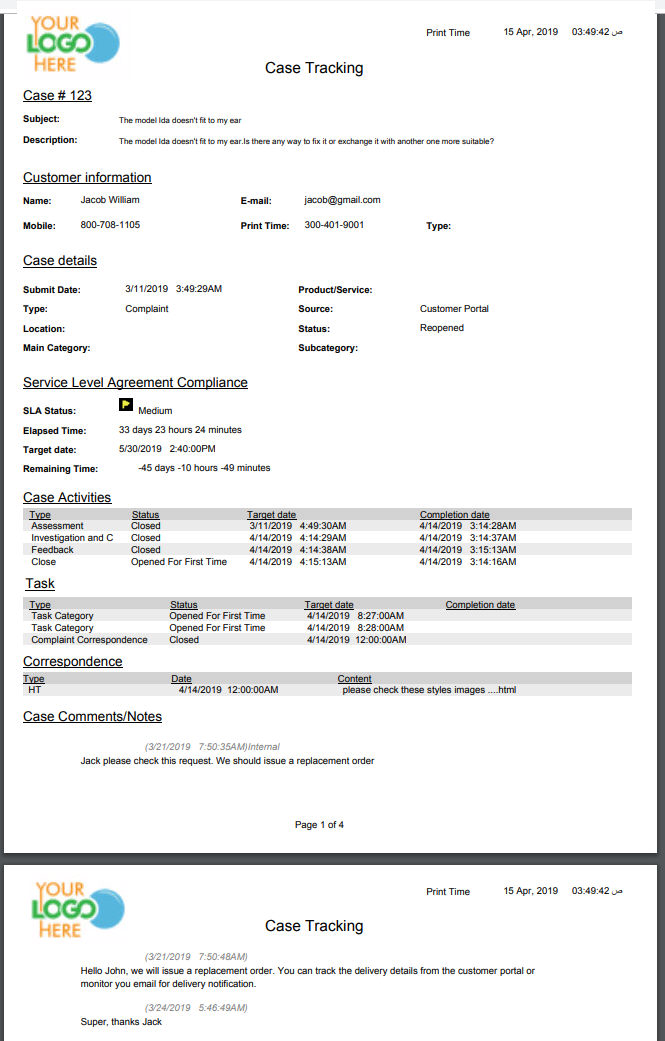
Case Tracking report
The Case Tracking report provides you with detailed information
about a specific case – all the
information you need in one place. It includes basic case information
such as case type, source, location, product/service etc. You can also
find detailed service level agreement compliance, list of activities completed
for these cases, all tasks completed, and any correspondence and notes.
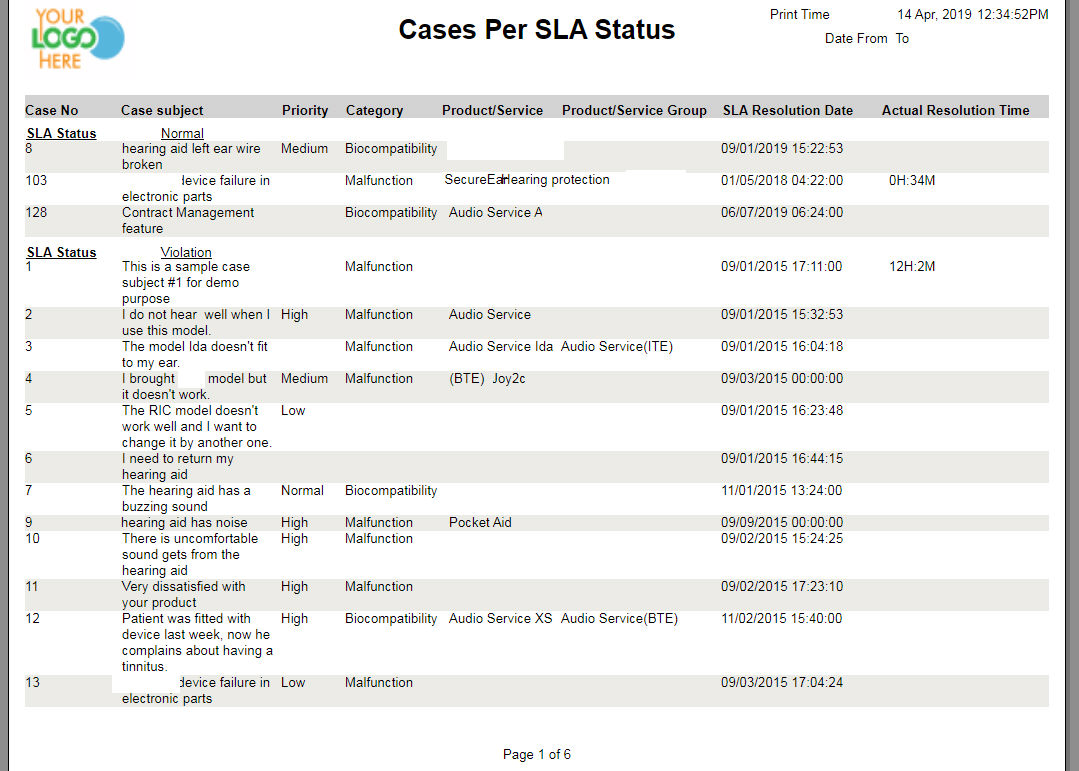
Cases per SLA Status report
The Cases per SLA Status report provides you with a list
of all the cases within a certain SLA status. NABD
allows you to print all cases or designate a specific SLA status – normal, warning, or violation.
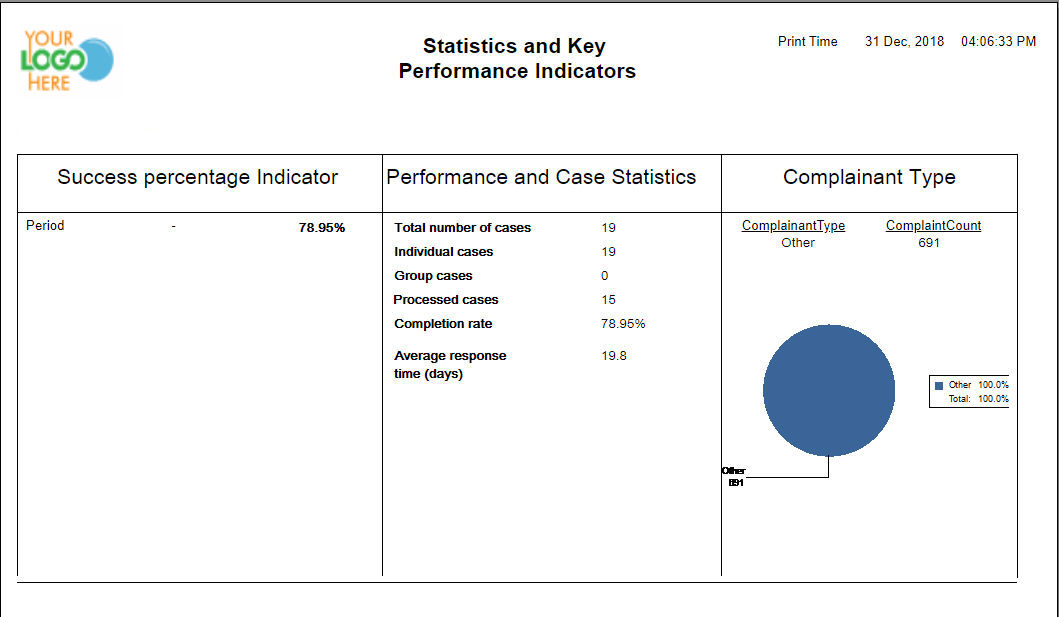
Statistics and Key Performance Indicators report
The Statistics and Key Performance Indicators report gives information
about the Success percentage Indicator, Performance and Case Statistics
and Complainant Type.
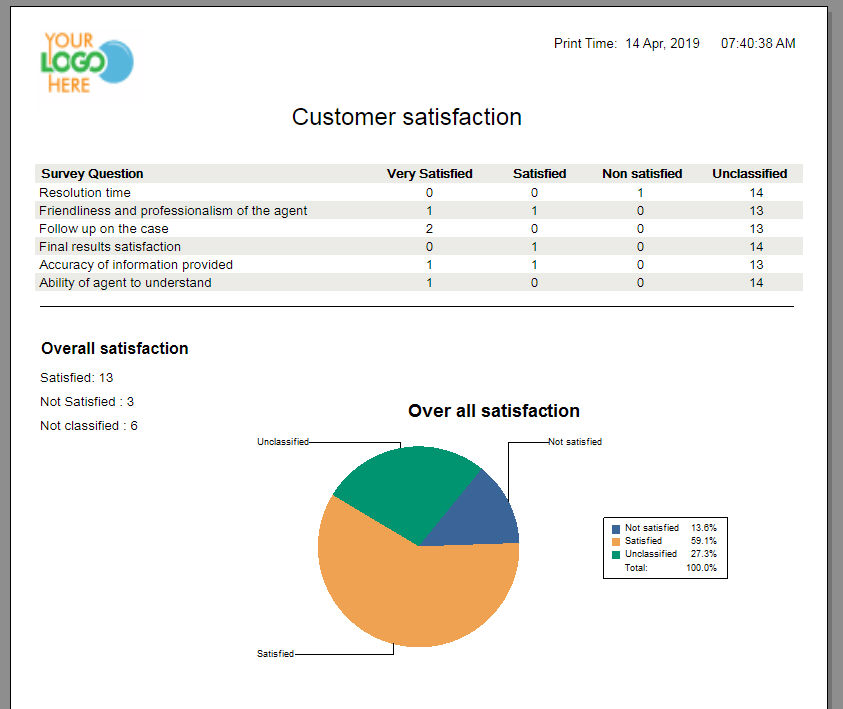
Customer satisfaction report
The Customer satisfaction report gives information about the customer's
feedbacks.
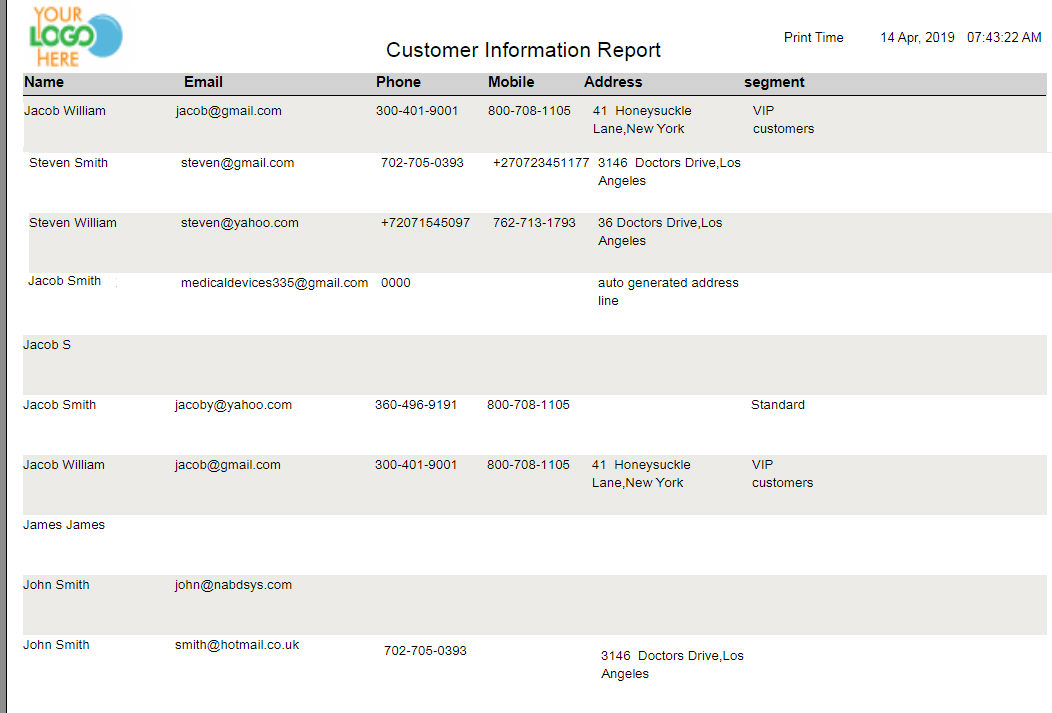
Customer Information report
The Customer Information report extracts all customer's informations
or specific customer's information.
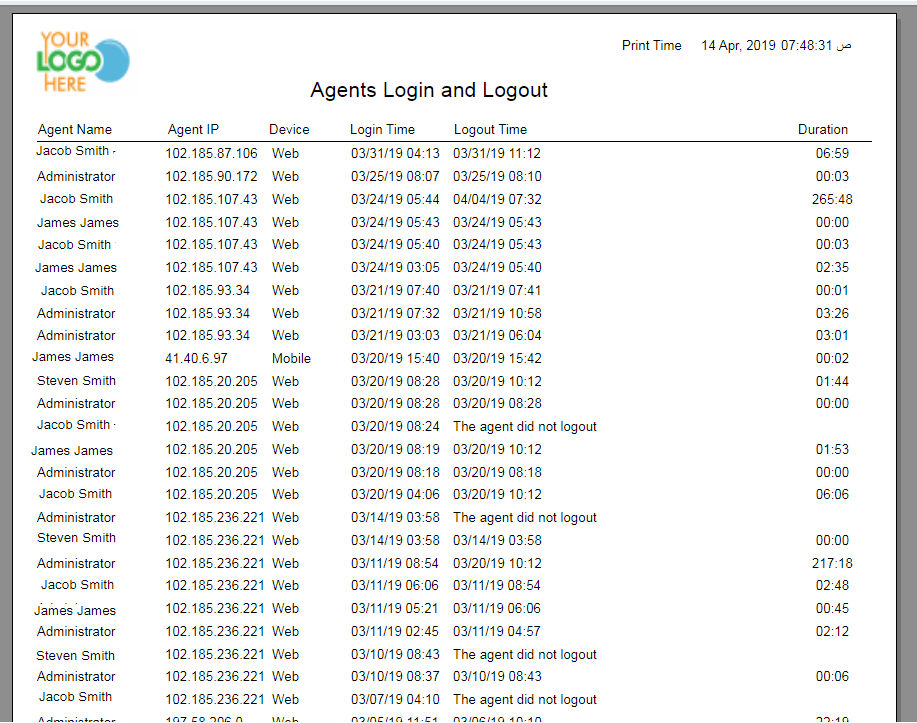
Agent login and logout report
The agent login and logout report gives an informations
about the agent login and logout time. –
normal, warning, or violation.
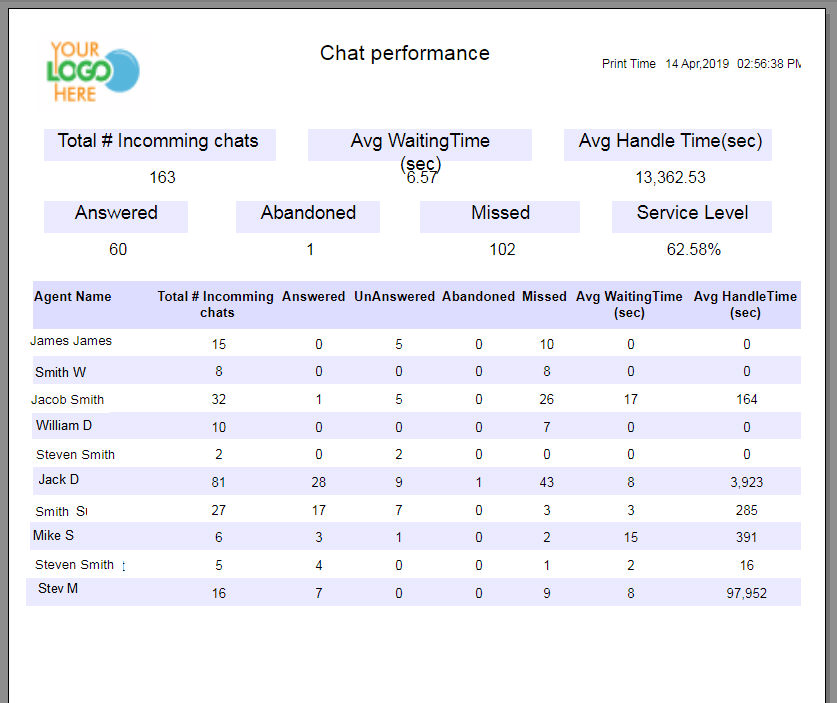
Chat performance report
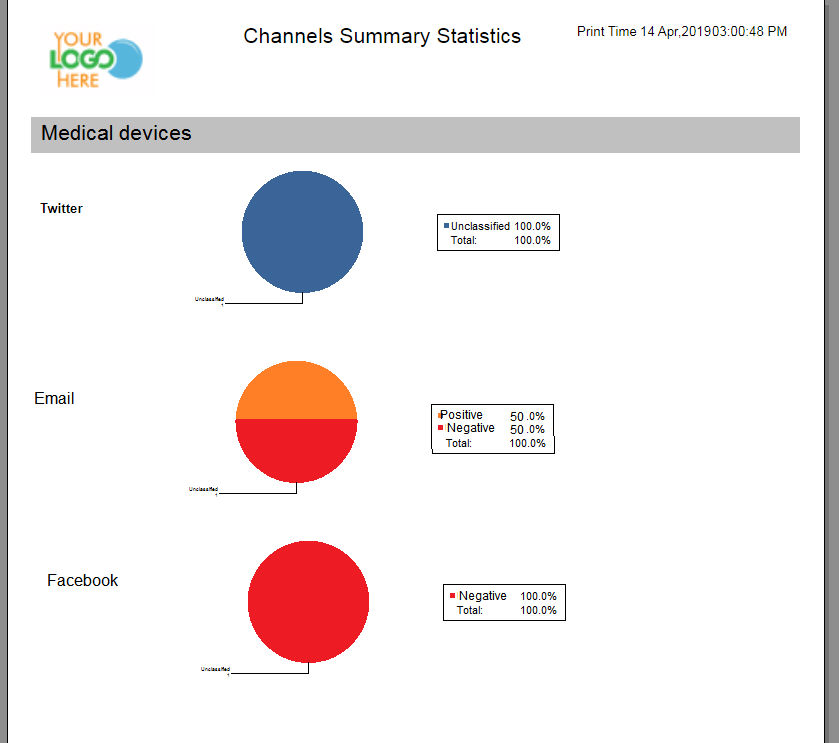
Channels Summary Statistics report
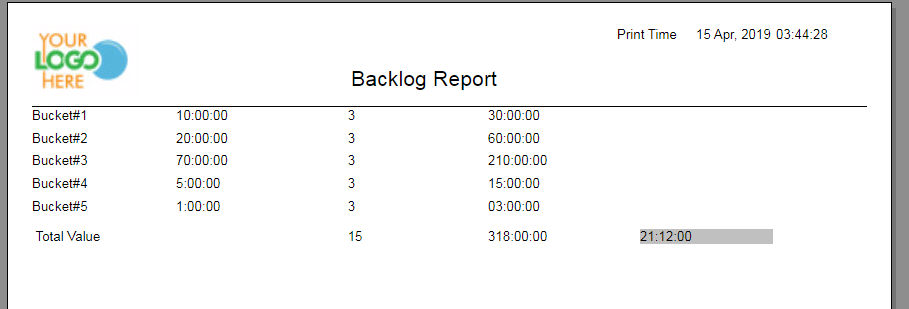
Backlog Cases report
The Backlog Cases report gives an informations about the
total number of cases at row time interval that are "open" for
column elapsed time.